Writing and editing
Edits what is there rather than rewriting it into its own voice.
A spreadsheet, two exports, a month of usage. The difference between this and asking a model to look at your data is that here it is counted - and what was counted is shown, so you can check it.
xlsx, csv or tsv. Formulas come along; it reads what they compute.
A count, a median, a difference - not 'what do you think of this'.
The tool result is in the answer, so the figure can be traced back to rows.
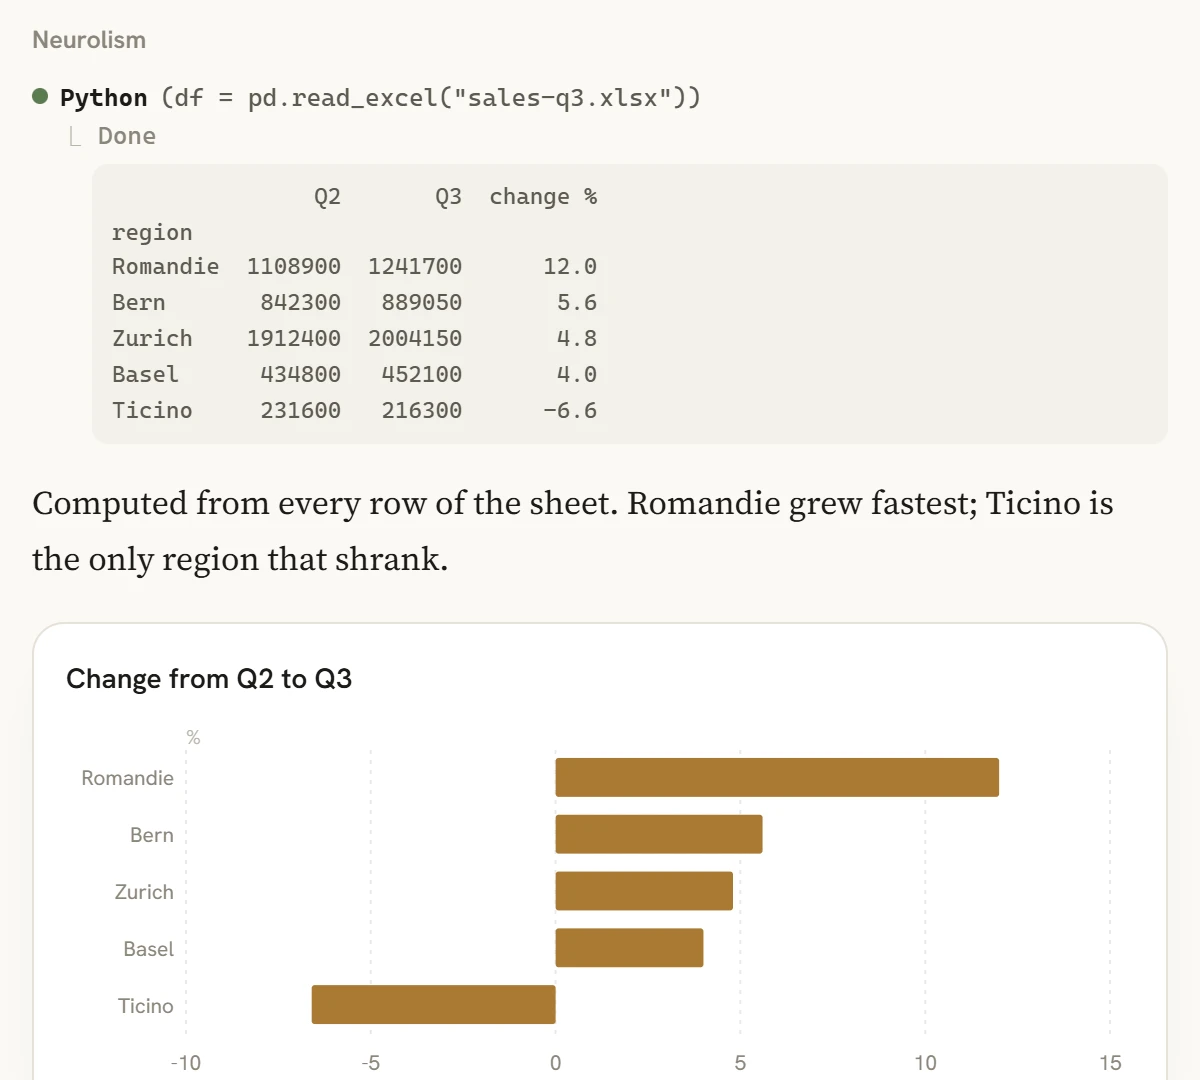
Attach a spreadsheet and it runs Python on it in your browser: pivots, statistics, regressions. The analysis runs on your computer, and the result goes into the answer.
It does not decide what the numbers mean. A correlation is a number; whether it is a cause is a question about the world, and nothing in a spreadsheet answers it. Where the model has to interpret rather than count, it says which part was which.
Here is last quarter's export. Which cost centres are more than two standard deviations from their own twelve-month average, and by how much?
Medium is enough for reading and counting. Large earns its keep when the question spans many sheets at once.
Compare the sizesFor anything statistical it calls a tool or runs Python in your browser, and that computes it. Asked for a median in prose, a model sorts in its head and lands near it - near the median is a different number.
Depends on the plan; the limit is shown before the upload. Very large tables are better queried than attached.
No training, no analysis, no profiling. It is processed to answer your question and for nothing else.
Edits what is there rather than rewriting it into its own voice.
Finds the passages. Does not tell you they are fine.
The small exact things, done exactly.